PaperBanana is back: GPT Image 2.6, Nano Banana 2.1 and plot mode
PaperBanana returns on November 10, 2026 with two image models, 2K output, isolated 300 DPI plotting, and per-round billing with automatic unused-round refunds.
PaperBanana is back online as of November 10, 2026. The site had been offline since around August 13. If you came back during that time and could not use it, thank you for giving it another look. Existing paid users' credit balances were preserved.
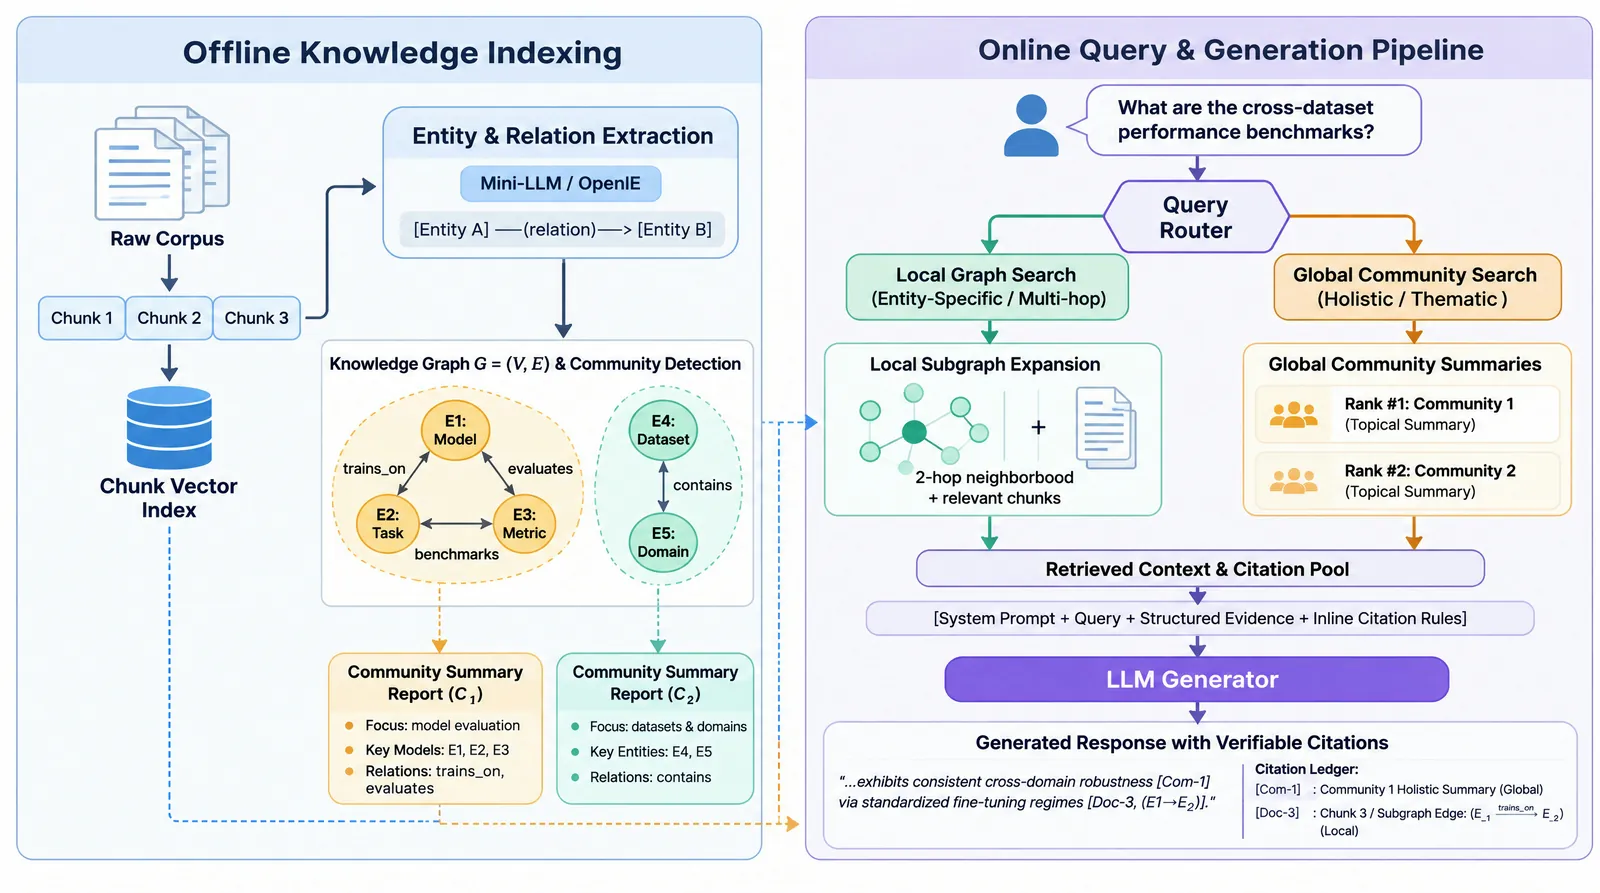
This relaunch brings a choice of image models, a separate plotting path, and clearer per-round billing. The examples below are actual outputs supplied for this release, rather than a benchmark or a promise that every prompt will produce the same quality.
What has changed
- Nano Banana 2.1 is the default image model for a balance of cost and everyday figure generation.
- GPT Image 2.6 is the premium option, best suited to text-dense figures, equations, and layouts with many labels.
- Gemini 3.8 Flash handles text reasoning and critique.
- Image output is 2K. Exact dimensions depend on aspect ratio; a 16:9 example is 2752×1536 pixels. The images on this page are smaller, web-optimized previews.
- Plot mode generates matplotlib code and executes it in an isolated sandbox at 300 DPI. It does not use an image model.
- The service now runs on Cloudflare Workers, D1, Workflows, and Containers, with globally served infrastructure. We have not measured a latency improvement to quote; generation typically takes 2–5 minutes per figure, depending on rounds and load.
Choose a model for the figure, not just the name
Start with Nano Banana 2.1 for a straightforward pipeline, a framework overview, or a figure you expect to iterate on. Its lower per-round cost leaves more room to explore.

Choose GPT Image 2.6 when the figure contains dense labels or equations. The GraphRAG-style example has an offline indexing path and an online retrieval-and-generation path, with many text blocks and connecting arrows.

The two-stage VLM example combines multimodal encoding, cross-attention, reasoning, and verification. These are illustrative outputs: check the meaning of every arrow, symbol, and label against your own method.

Credits are charged per round
| Mode / model | Credits per round | When to choose it |
|---|---|---|
| Nano Banana 2.1 (default) | 10 | Balanced everyday figures at a lower cost |
| GPT Image 2.6 | 15 | Text-dense figures, equations, and many labels |
| Plot / matplotlib | 10 | Statistical charts from data; no image model |
Selected rounds are charged upfront. If the task finishes in fewer rounds, the unused rounds are refunded automatically at that task's stored unit price. There is no free-first-draft offer in this billing model. An Image Edit request costs one round of the chosen model.
For example, three selected GPT Image 2.6 rounds reserve 45 credits. If only two rounds are used, 15 credits are refunded and the final charge is 30. You can see the model and estimated cost before generating.
Edit an existing figure
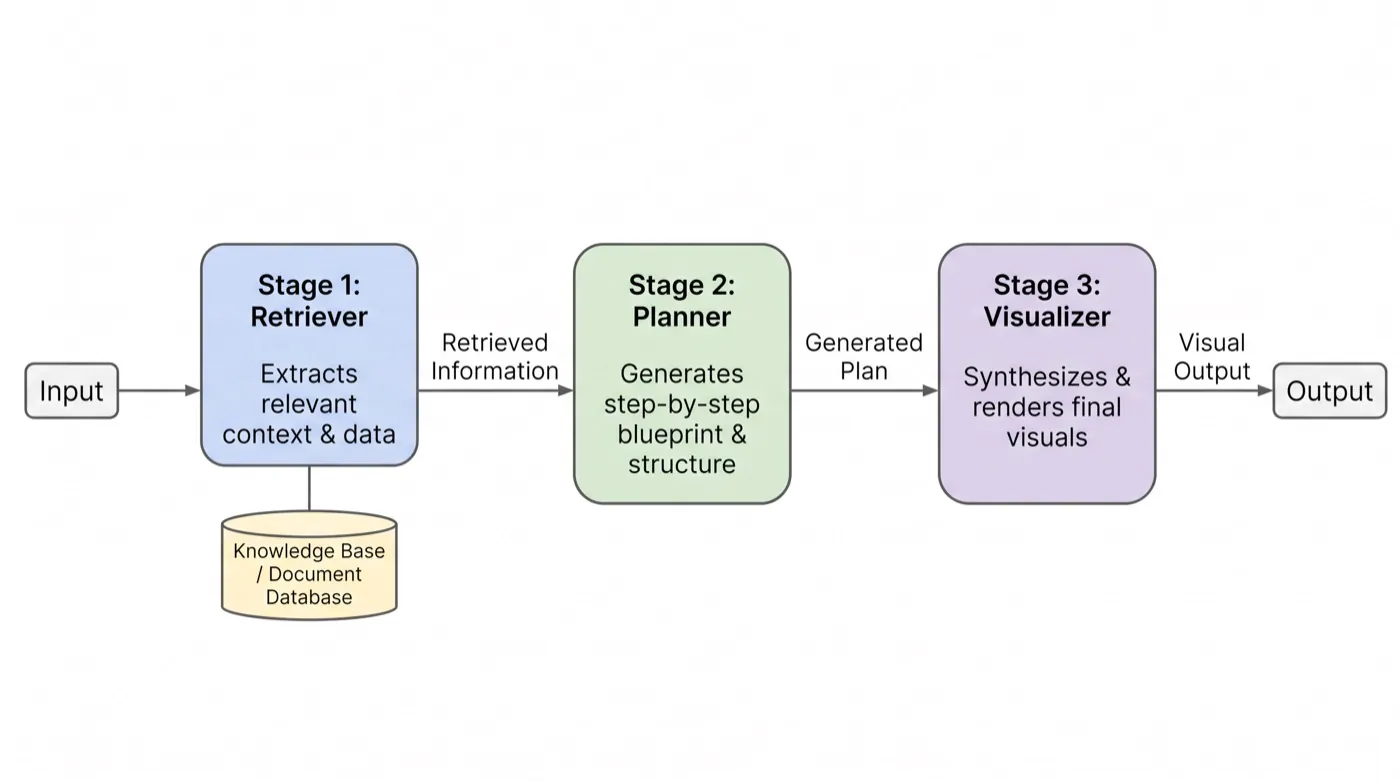
Image Edit can change a palette or add a legend from a natural-language instruction. Here, the request was to recolor a three-stage pipeline to navy and orange and add a legend while keeping the structure. View the original before editing.

Short FAQ
Should I use Plot mode for experimental results?
Use Plot when you want a chart from numeric data. Provide the data and explain the axes, grouping, and intended comparison. The service generates and runs matplotlib code in the isolated sandbox, with 300 DPI rendering. Check the plotted values and axis scales before using the result.
Are 2K images the same as vector figures or 300 DPI plots?
No. The image models produce raster images with dimensions set by the aspect ratio. Plot is a separate code-rendered path at 300 DPI. Check how the chosen output will look at its final print size.
Can AI critique guarantee a correct figure?
It can suggest improvements across rounds, but it cannot replace your review. Check equations, labels, data, and logical relationships, and follow your venue's AI disclosure policy.
What happens to my old paid balance?
Existing paid users' credit balances were preserved. Sign in with the same account to view your balance and transaction history.
Try it with one figure
Open Paper Visualizer, paste your methodology or data, choose Diagram or Plot, and review the displayed credit estimate. For a figure you already have, try Image Edit. View plans and credit packs when you need more rounds.
Author
Categories
More Posts

How PaperBanana Revolutionizes Academic Illustration with AI
Deep dive into the 5-Agent framework behind PaperBanana, the AI-powered system that transforms how researchers create scientific illustrations. Learn about methodology diagram generation, statistical plot creation, and sketch polishing.

PaperBanana: Completing the Final Piece of the AI Scientist Puzzle
In the wave of AI reshaping scientific research, PaperBanana fills the visual gap in automated research workflows. Deep dive into the agentic framework, benchmark evaluation, and future implications for fully autonomous AI scientists.

How to Create Publication-Quality Figures for Your Research Paper
A comprehensive guide to creating professional figures for academic papers. Learn DPI requirements, font sizing, color accessibility, tool selection, and how AI is transforming the figure creation workflow for researchers.
Stay Updated
Join the PaperBanana community
Get notified about new features, research tips, and early access opportunities